
澳洲住宅销售与新上市比
截至 7 月的三个月中,澳大利亚的住宅销售与新上市比率平均达到 1.4
Eliza Owen12 Aug 2021
在挂牌量较低的情况下,澳大利亚各地的住宅销售继续飙升。在截至 7 月的三个月内,CoreLogic 估计销量约为 171,100 辆。这比过去五年中每年这个时候通常看到的高 53.4%。同期,截至 7 月的三个月内,只有 121,200 处新广告出售的物业。
这使得“销售与新上市比率”在全国范围内达到近期高点,在截至 7 月的三个月内达到 1.4。销售与新上市比率的计算方法是将给定时期内发生的销售数量除以同一时间添加到市场的新上市数量。在过去十年中,该比率平均为 0.9,这表明每增加一次上市,就会发生不到一笔交易。
当比率为 1 时,表示买方需求和广告供应平衡。 1.4 的销售与新挂牌比率表明销售条件强劲,因为在同一时期内,每个新供应单位都会发生不止一次交易。自 2020 年 6 月以来,销售与新上市的比率平均高于 1。
每个首府城市市场目前的销售与新上市比率都超过 1,从阿德莱德的 2.0 到达尔文的 1.1。在 7 月之前实施封锁限制的首府城市的比率上升特别强劲,这可能是由于在封锁期间大量供应商推迟了销售活动的开始。下表提供了销售与新上市比率的时间序列。有多种因素可以解释相对于 2020 年中期的低挂牌水平导致的销售激增。在需求方面,这些因素包括:
抵押贷款利率低。买家需求的增加源于抵押贷款利率的持续下降。尽管担心抵押贷款利率会提前上升,但澳大利亚央行的数据显示,到 2021 年上半年,自住者的平均新房贷款利率下降了 12 个基点,投资者的平均新房贷款利率下降了 18 个基点。抵押贷款利率是住房需求的最重要决定因素之一,在目前预计 GDP 将再次下降的环境下,澳大利亚央行可能会在更长时间内促进低利率环境。
一笔储蓄意外之财。随着社会消费因封锁而下降,家庭财政支持增加,家庭储蓄在 2020 年第 6 季度达到家庭收入的 22.0%,高于当时 7.0% 的平均水平。结合到 2020 年推出的一系列购房激励措施,储蓄水平的提高可能会提高借款人的存款水平,从而引发自 COVID-19 爆发以来的额外销售。到 2021 年第三季度,储蓄率仍保持在 11.6% 的高位,这支撑了今年上半年的销量。
首次购房者的激励措施。 2020 年推出了多项首次购房者激励措施,从大流行前的首套房贷款存款计划到各种国家补助和优惠,以及购买/建造新房或楼花的激励措施。
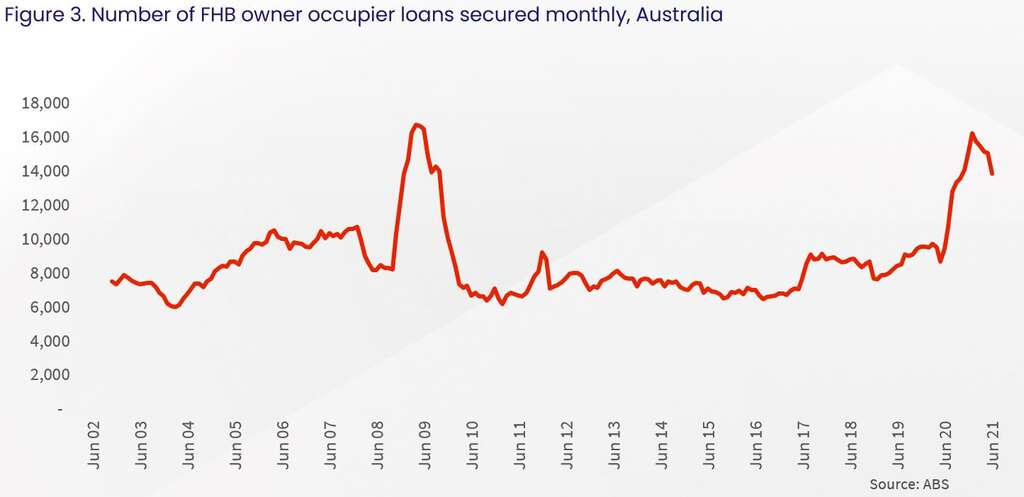
首次购房者购买将在很大程度上解释当前的供需动态。这是因为已经拥有房产的自住购买者大概会在购买新房屋时列出他们现有的房屋。另一方面,首次购房者活动创造了额外的住房需求,而无需向市场增加新的广告库存。下图显示了首次购房者的抵押住房贷款数量,这表明首次购房者的活动急剧增加。首次购房者贷款最近在 2021 年 1 月达到了 16,260 笔的峰值,几乎是抵押的首次购房者每月贷款系列平均值 (8,731) 的两倍。
尽管此后首次购房者的贷款承诺呈下降趋势,但截至 6 月份仍比系列平均水平高 58.8%。与首次购房者购买增加需求而不增加供应一样,自 2020 年中期以来,投资者的购买活动也呈上升趋势。与首次购房者活动不同,投资者购买并没有放缓。截至 6 月,有 18,625 笔用于投资者购买房产的抵押住房贷款,比 2020 年同月的承诺增加了 74.8%。
在供应方面,由于缺乏流动性和维州各地的封锁延长,新上市的房屋库存在 2020 年一直处于低位,
因此越来越少的澳大利亚人将其房屋挂牌出售。到 2021 年,市场上新增的股票实际上已达到与前几年持平的水平。在截至 7 月 4 日的四个星期内,CoreLogic 统计了全国市场上新增约 38,000 个房源,实际上高于五年平均水平。Australia’s dwelling sales to new listings ratio hits an average of 1.4 in the three months to JulyEliza Owen
12 Aug 2021
Dwelling sales continue to surge across Australia against low listings levels. In the three months to July, CoreLogic estimates there were around 171,100 sales. This is 53.4% higher than what has typically been seen this time of year for the previous five years. In the same period, there were just 121,200 newly advertised properties for sale in the three months to July.
This has taken the ‘sales to new listings ratio’ to recent highs nationally, at 1.4 over the three months to July. The sales to new listings ratio is calculated by dividing the number of sales that have taken place over a given period by the number of new listings added to the market over the same time. For the past decade, the ratio has averaged 0.9, suggesting for each listing added to market, there was just under one transaction that took place.
When the ratio is 1, it implies buyer demand and advertised supply is balanced. A sales to new listings ratio of 1.4 suggests strong selling conditions, as there is more than one transaction taking place for every new unit of supply in the same period. The sales to new listings ratio has averaged above 1 since June 2020.
Each of the capital city markets currently has a sales to new listings ratio of greater than 1, ranging from 2.0 in Adelaide, to 1.1 across Darwin. Capital cities with imposed lockdown restrictions through July saw a particularly strong uplift in the ratio, which may be a result of a disproportionate number of vendors postponing the start of a selling campaign amid lockdowns. A time series of sales to new listings ratios is provided in the charts below.
[iframe]"[/iframe]
Multiple factors can explain the surge in sales relative to low listings levels from mid-2020. On the demand side, these factors include the following:
Low mortgage rates. Increased buyer demand has stemmed from continuously falling mortgage rates. Despite concerns of an earlier-than-foreshadowed lift in mortgage rates, RBA data shows average new home loan rates for owner occupiers fell 12 basis points through the first half of 2021, and 18 basis points for investors. Mortgage rates are one of the most important determinants of housing demand, and in the current climate, where GDP is once again expected to decline, the RBA will likely facilitate a low rate environment for longer.
A savings windfall. As social consumption declined through lockdowns, and household financial support was increased, household savings peaked at 22.0% of household income in the June quarter of 2020, which was above the then-decade average of 7.0%. Combined with a range of incentives for home purchases introduced through 2020, increased savings levels may have bolstered borrower deposit levels, triggering additional sales since the onset of COVID-19. Savings rates remained elevated at 11.6% through the March quarter of 2021, which have supported sales volumes through the first half of this year.
Incentives for first home buyers. 2020 saw the introduction of multiple first home buyer incentives, from the first home loan deposit scheme before the pandemic, to various state-based grants and concessions, along with incentives for the purchase/construction of new or off the plan property.
First home buyer purchases would go a long way in explaining the current supply and demand dynamic. This is because owner occupier purchasers who already own property would presumably list their existing home around the time they are purchasing a new one. First home buyer activity on the other hand creates additional housing demand without adding new advertised stock to the market. The chart below shows the volume of secured home loans for first home buyers, which shows an extreme uplift in first home buyer activity. First home buyer loans recently peaked at 16,260 in January 2021, which is almost double the series average of monthly first home buyer loans secured (8,731).
Though first home buyer loan commitments have since trended lower, they remained 58.8% above the series average through June. In the same way that first home buyer purchases increase demand without adding to supply, investor purchasing activity has also trended higher since mid-2020. Unlike first home buyer activity, investor purchases are not slowing down. Through June, there were 18,625 secured home loans for investor property purchases, which is a 74.8% increase on commitments in the same month of 2020.
On the supply side, new listings stock was persistently low through 2020, as a lack of mobility and extended lockdowns across Victoria saw fewer Australians list their home for sale. Through 2021, new stock added to the market has actually hit levels that are on par with previous years. In the four weeks ending 4th of July, CoreLogic counted around 38,000 new listings added to the market nationally, which is actually higher than the five year average level. However, recent lockdown conditions have seen new listing counts slip back below the historic average, with Sydney in particular recording a -17.3% drop in new advertised stock over the past four weeks.
Part of the reason listings have remained low through lockdown conditions is the assistance offered to home owners seeing hardship through COVID-19. Mortgage repayment deferrals and household income support have kept distressed sales from hitting the market, and have more broadly been a factor in keeping housing market conditions stable. However, it has also contributed to a persistent seller’s market, which is reflected in the high sales to new listings ratio.
Source partily from
https://web.6parkbbs.com/index.php?app=forum&act=post&bbsid=2022
贴主:Lk1970于2021_08_16 2:14:41编辑楼主设置:谢绝布衣用户参与回复交流

内容来自网友分享,若违规或者侵犯您的权益,请联系我们
所有跟帖: ( 主贴楼主有权删除不文明回复,拉黑不受欢迎的用户 )
进入内容页点击屏幕右上分享按钮
楼主前期社区热帖:
- 请问你抑郁吗? 07/07/23
- 天国的原则之六—先感谢后蒙恩 01/12/23
- 让我怎样感谢你--元旦感悟 12/31/22
- 天赋和证明 12/23/22
- 一双鞋垫 12/18/22
- 旷野中的绵羊 12/06/22
- 婚姻是爱情的坟墓吗? 12/01/22
- 坦然无惧 09/16/22
- 《雪山之巅》- 下 (长文慎入) 09/15/22
- 《雪山之巅》- 中 (长文慎入) 09/15/22
- 《雪山之巅》- 上 (长文慎入) 09/14/22
- 206/4 Banilung St Rosebery 出售 09/08/22
- 难道是巧合吗? 09/04/22
- 困囚回 09/02/22
- 征服 08/23/22
- 安息下的自由 08/22/22
- 生死在舌头下 07/11/22
- 义人的三种时态 07/08/22
- 动物园的创意 06/27/22
- 从流泪谷到守望所 06/23/22
>>>>查看更多楼主社区动态...